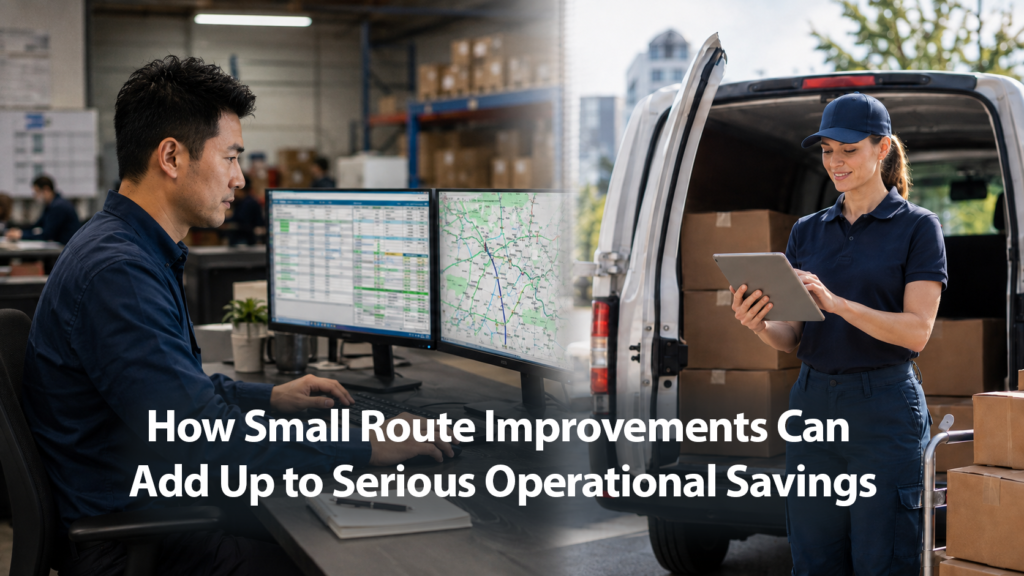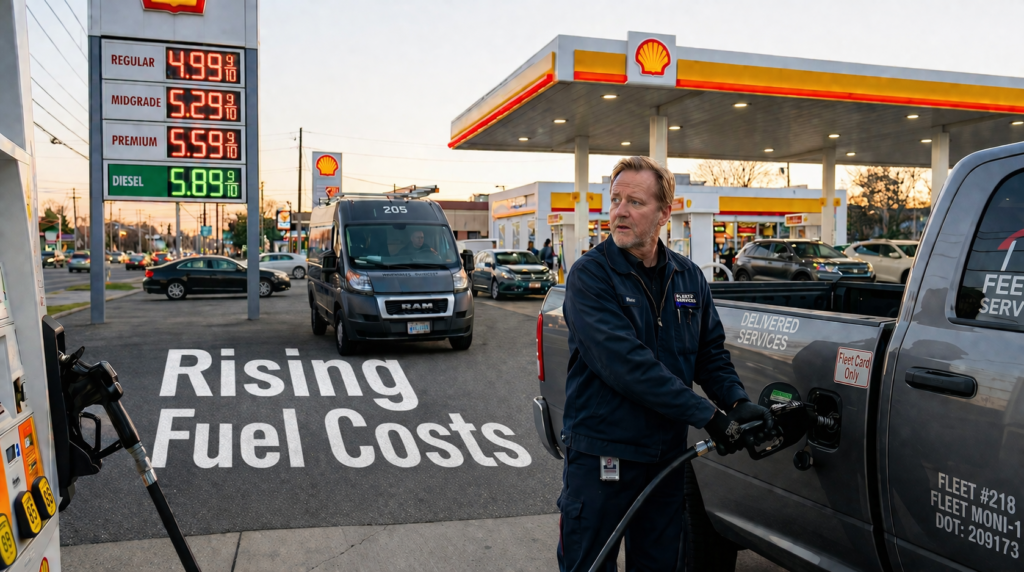

Small Route Improvements Can Add Up to Serious Savings
In fleet routing and scheduling operations, meaningful savings do not always come from dramatic changes.
Sometimes they come from tightening routes, fitting more work into the same day, or using vehicles more efficiently.
Those improvements may look small on their own. But when they happen across every route, every vehicle, and every operating day, the financial impact can add up quickly.
How small are we talking about?
For George’s Inc., a food distributor serving more than 250 restaurants, the improvement in road miles was just 5%. But the impact went well beyond mileage. The company reported $31,000 in annual fuel savings, reduced the number of vehicles required by 10% while maintaining service levels, and eliminated six hours of administrative work every week.
George’s operates 42 vehicles, so a 10% reduction represents roughly four fewer vehicles required for daily operations. Using a conservative estimate of 15,000 annual miles per vehicle and an industry maintenance benchmark of about $0.22 per mile, that could represent roughly $13,000 per year in reduced maintenance exposure.
The six hours of administrative time saved each week also add up to 312 hours per year. At a 2025 U.S. median dispatcher wage of $24.20 per hour, that represents about $7,550 in annual labor value.
Altogether, the reported and estimated financial impact comes to roughly $51,550 per year, before considering any additional value from the freed-up vehicle capacity.
And fuel is only one place where better routing can create value.
Route planning can also affect technician and driver time, overtime, delivery productivity, vehicle utilization, maintenance exposure, and even how many vehicles are needed to complete the work.
That is why a few percentage points can matter much more than they first appear.
The examples below show how small route improvements can translate into meaningful financial results across different types of fleet operations.

A Small Percentage Improvement Can Show Up in Different Ways
A 5% route improvement does not create the same type of value for every fleet. But using the same 5% lens makes it easier to see how quickly the dollars can add up across different operations.
For a field-service organization, one of the biggest opportunities is often technician time.
Cardata’s field-service research found technicians averaging approximately 1,106 business miles per month, showing how much travel can accumulate across a mobile workforce.
Consider an illustrative 50-technician operation where each technician costs the business $50 per hour fully loaded and spends two hours per day travelling between jobs. That represents roughly $1.25 million per year in technician travel time.
A 5% reduction in travel time would represent approximately $62,500 per year in technician-time value.
And that level of improvement is not unrealistic. A real-world telecommunications field-service study found that optimized technician routing reduced travel time by approximately 16%. Applied to the same illustrative 50-technician example, that would represent approximately $200,000 per year in technician-time value.
Better routing may also create room for additional appointments or reduce overtime, adding further value beyond travel time.
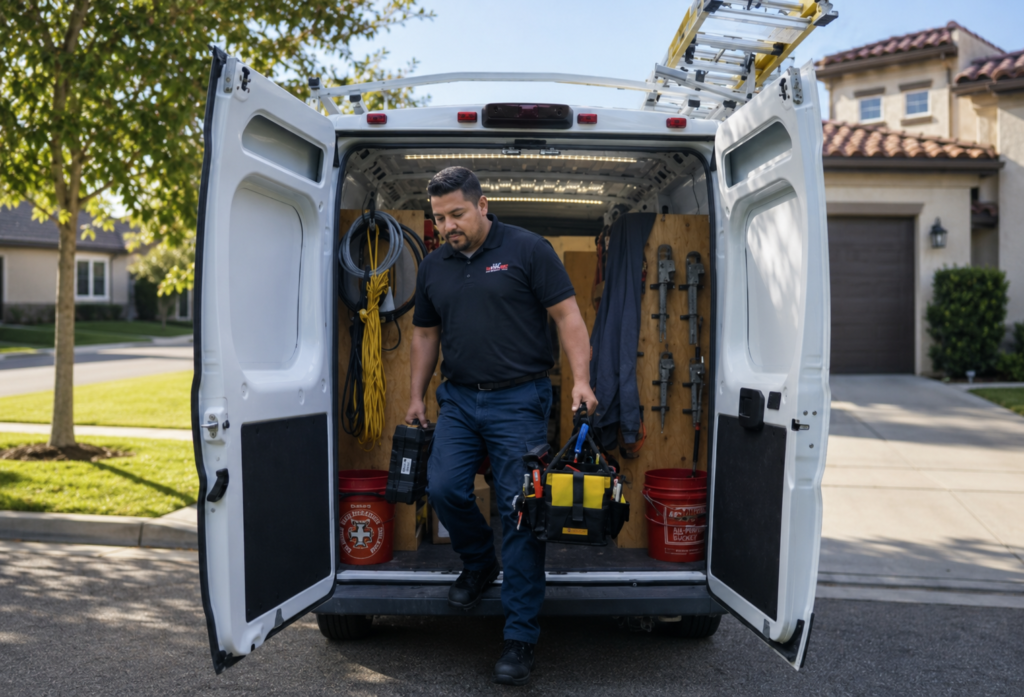
For last-mile delivery, the same 5% improvement can play out across thousands of individual deliveries.
BCG’s 2026 parcel-logistics research found that last-mile delivery accounts for approximately 50% to 60% of total parcel-delivery cost, while more than one in seven carriers reported average delivery costs above $5 per parcel.
Using that $5-per-delivery benchmark, an operation completing 100,000 deliveries represents at least $500,000 in delivery cost.
Five percent of that cost base represents approximately $25,000 in annual delivery-cost value.
The opportunity becomes larger as delivery volume grows. At 500,000 deliveries, the same benchmark represents $2.5 million in delivery cost, meaning 5% of that cost base represents approximately $125,000.
And there is plenty of pressure to find those efficiencies. FarEye’s 2025 U.S. last-mile research found that average delivery costs increased by approximately 12% from 2024 to 2025, with route inefficiencies, fuel use, driver hours, and vehicle wear among the factors affecting delivery costs.
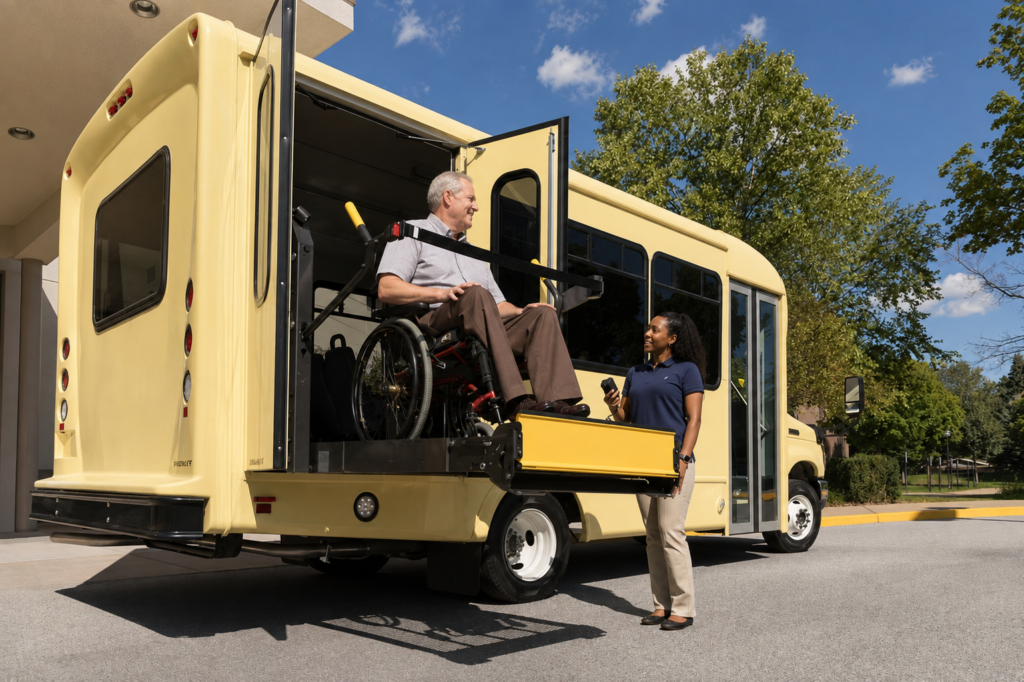
For passenger transportation, the dollar impact can be even more visible because operating costs accumulate across every vehicle mile.
In 2024, Sacramento-based Paratransit, Inc. reported approximately 464,000 annual demand-response vehicle revenue miles and $2.94 million in annual demand-response operating expenses, equivalent to $6.34 per vehicle revenue mile.
Five percent of that annual operating cost base is approximately $147,000.
That does not mean a 5% route improvement automatically produces $147,000 in cash savings. Passenger fleets still need to meet pickup requirements, schedules, capacity limits, and service commitments, while some costs will remain fixed.
But it shows the financial scale involved. If better routing can reduce avoidable mileage, driver time, or vehicle requirements while maintaining the same level of service, even a relatively small percentage improvement can touch a substantial amount of annual operating spend.
Sometimes the Bigger Saving Is the Vehicle You No Longer Need
Reducing mileage and operating cost is valuable.
But sometimes better routing can create a much bigger opportunity.
What if the same workload can reliably be completed with one fewer active vehicle?
The economics can change considerably.
Instead of only reducing fuel and mileage-related expenses, a business may be able to avoid or defer costs associated with acquiring, leasing, maintaining, insuring, parking, or eventually replacing another vehicle.
But that cannot be determined by mileage alone.
The work still has to fit.
Customer time windows need to be met. Vehicles have capacity limits. Drivers have shifts. Some jobs require particular skills or vehicle capabilities.
Scheduled Routes accounts for these types of constraints during optimization. Its documentation also includes a Minimize Vehicles Used strategy specifically designed to test how many vehicles are actually required to complete the work.
So the bigger question is not simply:
“Can we drive fewer miles?”
It is:
“Can we complete the same work with fewer miles, less time, or fewer vehicles?”
Small Percentage Improvements. Big Impact.
There is no universal answer to what a small route improvement is worth because every fleet operates differently. But even modest gains can create meaningful value when repeated across an entire operation.
For field service, that may mean less technician travel. For last-mile delivery, lower costs across thousands of stops. For passenger transportation, better vehicle utilization. And for some fleets, the biggest opportunity may be completing the same workload with fewer vehicles.
The value comes from turning better routes into measurable reductions in miles, labor, operating costs, and vehicle requirements. Small gains can already matter, while fleets with more inefficiency may have considerably more opportunity to uncover.
Finding those gains is difficult when planners are balancing stops, time windows, vehicle capacities, shifts, and daily changes all at once. The challenge is not simply creating shorter routes, but finding the most efficient way to complete the work.
This is where a route optimization solution like Scheduled Routes can help. Scheduled Routes helps fleet teams build multi-stop route plans around the operational constraints that actually affect the day, including time windows, vehicle capacity, shifts, and required skills.
It can also help operators test different routing strategies, including whether the same workload can be completed with fewer vehicles. That gives businesses a more practical way to identify where routing improvements can translate into real operating savings, whether those gains are modest or much more significant. In fact, Scheduled Routes is designed to improve fleet efficiency by up to 20% and reduce total fleet mileage by up to 30%, showing how the opportunity can extend well beyond the smaller improvements explored in this article.
From there, the question becomes specific to the individual operation.
How much could better route planning actually save across your fleet?
Contact Scheduled Routes for a quick consultation and get an estimate of where greater routing efficiency could create savings across your operation.